With the first quarter of 2023 behind us, earnings season is in full swing. Overall, inflation shows signs of slowing, while rate cuts come to an end. Moreover, the recent GDP numbers came in surprisingly strong.
However, volatility in the banking sector continued. Despite the market rally, recession concerns persistently dominate the headlines.
Financial System Remains Resilient in the First Quarter of 2023
Notably, the first part of the banking crisis is behind us. Deposit outflows stabilized. Additionally, all but a handful of banks reported solid earnings in April 2023.
However, regional bank share prices stay exceptionally volatile and bank stability concerns return to the forefront.
Banking Sector Remains Stable in First Quarter of 2023
While investors in regional banks faced volatility, it is important to reiterate the broader bigger picture – the US financial system remains stable and sound. Bank runs and crisis of confidence events at individual institutions are always going to be a risk our system contends with, but the broad health of the system is not in question.
Although periods of instability and uncertainty create detrimental circumstances for individual banks, the long-run fundamentals still matter. Holistically, the United States financial system carries forth in its fundamental stable.
Banking Strategy Pivots to Expressing Cautious Approach
That said, it is not business as usual. Banks across the country stabilized deposit flows, but they are forced to play defense. The system shock shifted perspectives for bankers nationwide; no longer will they be rewarded for originating new loans and aggressively lending the bank’s money.
Rather, being cautious and careful defines the new game. Historically, this kind of tightening of credit standards and newfound reluctance to originate loans leads to a slowing economy.
The Upside of Tightening Credit Standards
Furthermore, this slowdown in credit creation is exactly what the Fed has been trying to achieve. Recent rate hikes make taking on debt less attractive – they are designed to slow the economy down. While the Fed did not want to see a bank crisis, the unintended consequence is that now it is not only rates that are high, but also banks are going to be reluctant to lend as they hoard cash.
While counterintuitive, the tightening of credit standards and slowing loan formation could be positive for the markets. Nobody is rooting for a deep recession or systematic destabilization akin to what we saw in 2008, but a mild slowdown that puts the breaks on inflation and allows the Fed to normalize rate policy? That would give markets a chance to normalize and start being more forward looking.
Can We Achieve a Soft Landing?
An economic slowdown that brings price stability and removes uncertainty from the Fed’s rate hike program is wonderful, but a deep recession is painful and something we would like to avoid.
Right now, the data indicates we are still on track for a “soft landing” or mild recession and can avoid a depression and deep economic pain.
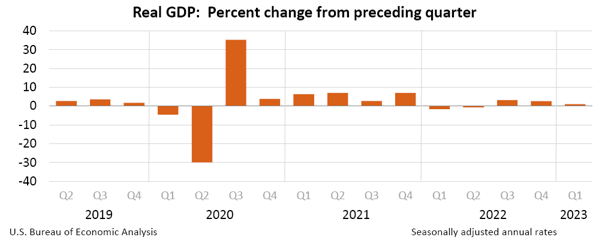
First Quarter of 2023 Shows Growing GDP Estimates
First, just look at the most recent GDP estimates. Advance estimates released at the end of April for Q1 of 2023 show real GDP growing at 1.1% for the quarter. Taking inflation out of the equation, which is a 5.1% growth rate.
While most economists care about the real GDP growth number, after accounting for inflation, it is important to keep in mind the gross 5.1% number because companies report their revenues and earnings without any inflation adjustment. Said another way, economic growth continues to support a broader expansion in corporate earnings, even as we go through a period of financial instability.
Employment and Job Data Reveals Strong Labor Market
Beyond broad GDP numbers there are other metrics worth examining. Employment is particularly noteworthy. As long as unemployment stays low, it is difficult to see us falling into any sort of deep recession or real economic crisis. On this metric the United States is wildly outperforming expectations. Unemployment simply refuses to go up.
Unemployment data from the St. Louis Fed show a rise from around 1,300,000 continuing unemployed insurance claims when the labor market peaked around September of 2022 to 1,858,0000 claims in April 2023. While that sounds high, put it in context: During the Great Financial Crisis, we saw continuing claims peak well over six million. Worth noting these claims peaked over twenty million during COVID-19. Framing it another way, the current unemployment rate is around 3.5%, up from post-COVID low of 3.4%. However, they are nowhere near the unemployment rates we saw during COVID and the Great Financial Crisis.
The strength in employment does not look like it is fading either. While businesses are cutting back on hiring, the broader anecdotal message is that it is exceptionally difficult to find talent right now. Skilled labor appears particularly difficult to find with manufacturers and homebuilders both reporting difficulty hiring. These anecdotal statements are backed up further by job openings data. According to the Bureau of Labor Statistics, we still have more than 1.6 job openings per unemployed person.
Consumer Spending Stabilizes as Savings Rates Increase
Finally, it is worth discussing the health of the American consumer. Consumer balance sheets broadly stabilized in Q4 of 2022, despite having faced inflationary pressures earlier in the year.
Furthermore, savings rates are increasing. In fact, savings rates climbed above 5%. This comes after rates fell under 3% in the summer of 2022 (when inflation was at its worst).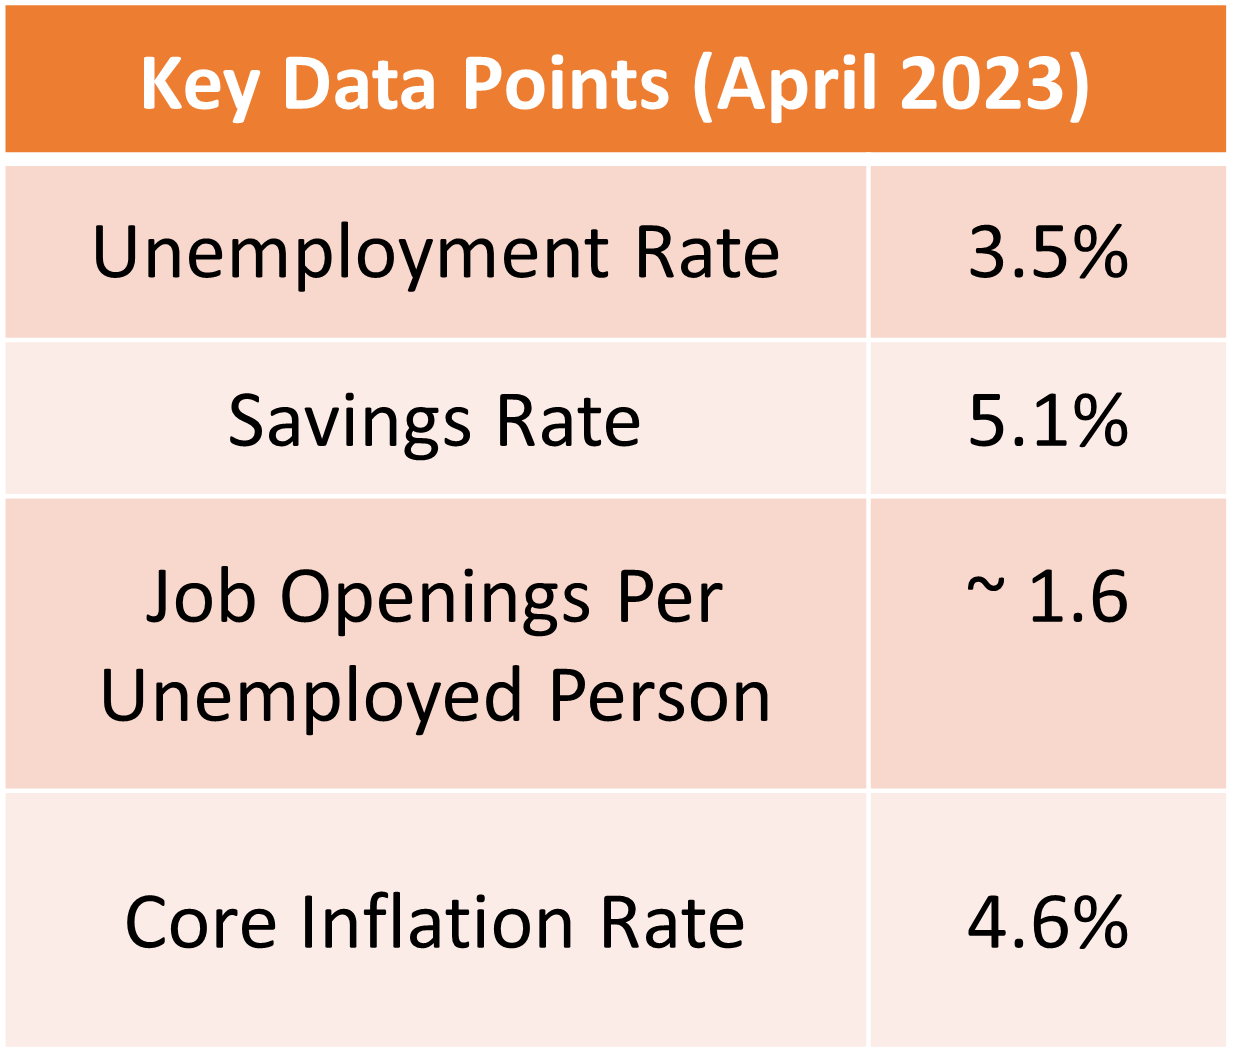
General Market Outlook Coming Away from the First Quarter of 2023
Markets have rallied into 2023 as the path forward on rates and inflation becomes clearer. While there is still significant economic uncertainty, the view for rates appears to be more stable. This mindset broadly buoyed moderate market optimism.
However, we believe it will be difficult for equities to return to 2021 levels over the next few months. Markets need more certainty around the broader economic outlook, prior to picking up steam. Additionally, investors seek insight as to whether the economy can achieve a soft landing.
Pricing Adjustments to Come After First Quarter of 2023
Nonetheless, while companies remain cautious with their annual guidance, they are generally hitting or beating their earnings numbers. While that sounds surprising, take a moment to consider how inflation impacts corporate earnings. At the beginning, inflation usually costs the companies. First, raw materials for products see price increases.
Second, labor prices rise as workers demand more compensation. However, over time the companies can adjust their prices for inflation. More so, revenues tend to rise during and after inflationary periods. It might take several quarters for new pricing to take effect. Contracts have to be renegotiated. In addition, customers have to get comfortable with new pricing dynamics. Over the medium term, companies can raise prices and keep their margins intact.
Fixed Income Improves Along with Global Markets
Fixed Income markets saw improved fundamentals as they neared the end of the rate hike cycle. Overall, yields on bonds are more attractive than they were at this time last year. Higher yields mean more cushion for investors – future interest rate hikes or cuts will have significantly smaller impacts on bond prices now that yields are so much higher.
Outside the United States, the rest of the globe is also starting to find stability. China is emerging after its COVID restricted slump with low interest rates and high savings rates. Furthermore, South America is starting to see green shoots. Recently, Uruguay became the first South American country to cut interest rates since the COVID-19 crisis, putting their inflation fight in the rear-view mirror. Even Europe is finding its footing after the forced consolidation of Credit Suisse settles down.
Looking Ahead After First Quarter of 2023
Looking ahead, there is still uncertainty. On the plus side, it looks like we have made it through the worst of the Fed’s hiking cycle.
Also, the United States economy passed through a challenging time for inflationary pressures and banking. Now, we can look forward to economic stabilization, and hopefully, a resumption of business as usual.
Information accredited to LPL Financial.
After the first quarter of 2023, it is time to reevaluate market strategies. To update your financial plan for 2023 and the years to come, contact the nationwide advising team at IHT Wealth Management today!
The opinions voiced in this material are for general information only and are not intended to provide specific advice or recommendations for any individual. All performance referenced is historical and is no guarantee of future results. All indices are unmanaged and may not be invested in directly.
Investment Advice Offered by IHT Wealth Management, a Registered Investment Advisor